September 2017 | Resource
First Contact Resolution
Understanding, measuring, and implementing this key contact center metric to improve customer satisfaction
First Contact Resolution (FCR) is an important metric for every business—regardless of its size or industry. It measures how often a customer’s issue is resolved the first time they contact an organization, essentially indicating how easy it is for a customer to do business with an organization.
For organizations that have dedicated contact centers, the FCR metric—tracking it and improving it—is paramount to success.
Unfortunately, FCR can be difficult to track and report on, since it can be defined and measured in multiple ways. A detailed definition for FCR allows organizations to establish clear expectations and consistency in the contact center, as well as create realistic targets. Establishing ways to report on FCR enables you to measure results and gauge progress toward targets.
Focusing on FCR can meaningfully drive operational efficiency and customer satisfaction. However, it is important to note that FCR may increase Average Handle Time (AHT). Service associates that seek to satisfy a call reason during the first contact may have longer call times. While this initially looks like a downside, focusing on FCR reduces the overall number of calls your department receives. (If only half of your calls are resolved on the first touchpoint, for instance, the other half will need to call back at some point creating additional call volume.) Although you may have an initial increase in operating costs due to increased handle times, over time, an increase in FCR should result in a decrease in operating costs due to a reduction in call volumes.
Chapter 1: How is FCR defined?
First Contact Resolution can be defined in many ways. What is important, is that your organization defines FCR up front and communicates this definition across the organization. Your measure of FCR should be accurate, consistent, and understood among employees and the leadership team.
When determining how to define FCR for your organization, you should consider why you are measuring FCR. Is your goal to increase customer satisfaction? If so, you should likely define FCR from the customer’s perspective. (See “Quality Monitoring Program Data” on pg. TK.) If your goal is to identify opportunities in your organization to reduce transfers or streamline processes, you should frame the definition from an operational perspective.
If your goal is to identify where your service associates are following policies and procedures, then you could likely have a more relaxed view of FCR and define it through a simple question: “Did the agent do everything in their power to give the customer what they needed to resolve the issue?”
For the purposes of this guide, we will define FCR as any situation in which “a customer’s contact reason is satisfied in one interaction with one person.” This means the customer does not have to be transferred to or speak with multiple service associates during their interaction and follow-up by the organization or the customer is not required to resolve their contact reason.
An illustrated example of this definition: Suppose a customer contacted the organization to inquire about a charge on their bill. If the service associate who works with the customer can answer the customer’s question during the first contact and the customer has no additional questions or needs, the contact would be considered resolved during that single interaction – First Contact Resolution. If the service associate that works with the customer cannot explain why there is a charge on the customer’s bill, must follow up with the billing department, and then calls the customer back, the contact would not be considered FCR because additional follow-up was needed and multiple contacts with the customer occurred.
How do I measure for it?
At its foundation, First Contact Resolution is calculated as the percentage of contacts in which FCR was achieved. However, there are two primary concepts or philosophies on how to calculate FCR. These two philosophies can be labeled as Customer FCR (Gross FCR) and Operational FCR (Net FCR). Both are important and provide different insights into your organization.
- Customer FCR (Gross FCR) examines the total population of customer contacts and measures FCR from the customers’ perspective. It helps an organization understand the true percentage of time that it resolves customer issues in one contact. To a customer, an organization that can’t resolve an issue in one interaction means that it was not FCR - even if the agent did everything within his or her power in that moment, and even if additional interactions are required simply due to the way the organization’s internal processes are designed. Not only does gross FCR allow an organization to better understand the customer’s perspective, it also helps organizations identify which processes are high-effort or require a lot of handoffs and follow-ups. At many organizations, it is impossible to ever achieve 100% gross FCR because of the way certain processes are designed; some contacts will always require handoffs or a follow-up.
- Operational FCR (Net FCR) only examines the population of customer contacts that are expected to be able to be resolved by a service associate. It essentially ignores any contact that is expected to result in a handoff or follow-up due to organizational policies and procedures.
- Net FCR helps organizations understand and measure service associate performance with respect to customer service. It helps management differentiate between the interactions that the service associates should have been able to handle and didn’t, versus the interactions that the organization’s processes prevent the service associate from resolving on their own. Assuming zero human error, a 100% net FCR is achievable because the denominator only accounts for contacts that a service associate should be able to handle on their own.
Nuances in an organization’s ability to report out on this metric makes it difficult to scientifically and perfectly capture FCR. For instance, duration can skew FCR: If your data set represents all repeat calls from January 1 through January 14, you may miss the first call from someone who called on December 30 and then again on January 2. Realistically, that January 2 call should not count as FCR, as it is the second call for the same reason. Based on this data set, however, it would show as FCR.
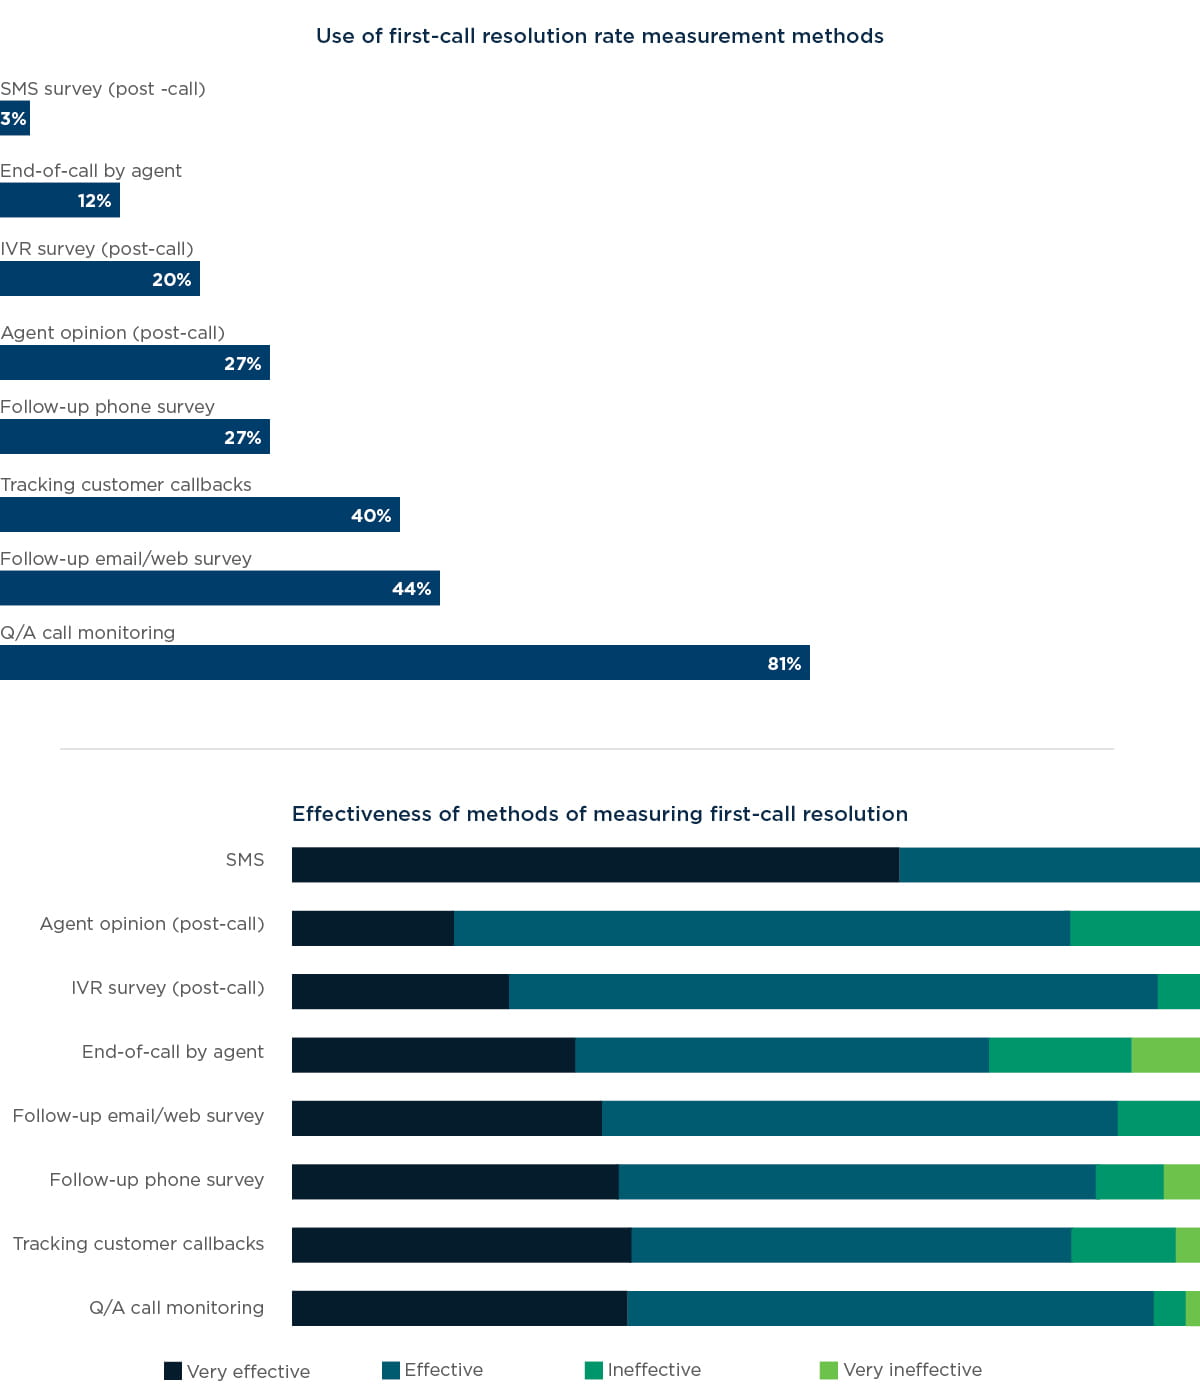
FCR can be reported using multiple data points. None of these are perfect, but the document outlines all the ways you can measure FCR to help determine the best method for you. We often recommend using multiple data points to create a more comprehensive picture of FCR. The methods we will outline are:
Each method has a section below with detailed explanations, defined constraints or considerations when using the method, and recommended use cases for the method. You may have noticed that we did not include agent-reported FCR. This is because the method is the least objective of all methods. You can read more about this in the Quality Monitoring section below.
Chapter 2: What should my target be?
Because of the complexities of the data, FCR targets vary widely among industries and organizations. However, it is generally accepted that organizations with highly empowered service associates that require few handoffs are expected to have a high gross FCR, whereas organizations with “log and dispatch” contact centers that document issues and initiate follow up will have a low FCR.
In an analysis of service centers across all industries, the average Gross FCR was 74%, with low-handoff organizations averaging 94% and high-handoff organizations averaging 41%². Keep in mind that for Net FCR, organizations should expect to be close to 100%, meaning that service associates should achieve FCR for nearly every interaction in which they are expected to achieve FCR.
Targets should be established based on historical information available to you from the various reporting methods that will be leveraged going forward. If this is the first time you are measuring FCR, it isn’t unusual to start with a low target. Your performance will naturally improve now that you are reporting on this data and bringing your agents’ attention to it. Your FCR targets should be continuously evaluated and updated. As organizational processes and self-service functionality improves to be more customer-centric, and as focused training occurs, your target should be expected to go up.
Chapter 3: FCR reporting methods
Telephony call data
FCR, using telephony call data, looks at inbound calls to see if the same phone number called just once or multiple times within a given timeframe. From this data, we report on the percentage of inbound calls whose number only appears one time in a set duration. The numerator is the total number of unique phone numbers. The denominator is the total number of calls. Recall that when using the total population of calls, you are measuring Gross FCR.
For example, if there were 1,000 calls in a set duration, and 900 of the phone numbers only appeared once, we would report on a First Contact Resolution of 90% (900/1,000). This data assumes that if an inbound phone number only called one time in a four-week period, we achieved FCR; the customer did not need to call us again, so we assume that their issue was resolved during the first contact.
Considerations for this method:
- It is important to note that this measure looks at call data only. This has the potential to eliminate repeat contacts made through other channels (e.g. in person, via chat, etc.). For example, if a customer visited the lobby to ask a question and called us the next day to follow up on the question, telephony data would count the single call as FCR, when it was not. This is considered a false positive.
- This data can also produce false positives if a customer calls twice, but from different phone numbers. For example, if a customer calls today from a cell phone, and then calls again in one week from a home phone, telephony call data alone cannot recognize that the same customer contacted us twice, and will count each call as FCR.
- This data can produce false negatives if a customer calls twice, but about different call reasons. For example, if a customer calls us with a billing question today and we resolve their call reason during the call, then they call us back next week about a product issue, telephony call data only recognizes that they contacted us twice in a given timeframe and will not count the calls as FCR.
Purpose/how to use the method:
This report is most useful for identifying repeat callers and targeting follow-up as needed. This is arguably the least accurate of all the FCR methods.
Gross FCR%
FCR is an indicator of the volume of potentially unnecessary repeat calls your contact center is handling. You should be using this report to look at operational changes. If your FCR is low, then you know you have incoming repeat calls that are using valuable resources. Action Items:
- Look at this number at least every two weeks to understand trends.
- For problematic (high-volume) customers, listen to their call recordings, look up their accounts, and follow up with them directly to better understand the root cause of their contacts.
- Identify any trends in performance that may be causing repeat calls. Work with the training manager and QA manager to react as needed.
Agent desktop/customer relationship management (CRM) data
FCR, using CRM data, should pull all interaction data from the customer’s account during a set duration. If each interaction has a reason code documented, you can check to see if the customer contacted you multiple times for the same reason within a given timeframe. Many CRM systems can also be used to track if the interaction required any follow-up action based on linked activities or service orders. For the purpose of this guide, we will call those linked records “action items.” Using this data, an interaction qualifies as FCR if there are no other interaction records with the same reason code and if there are no associated action items. This tracking mechanism accounts for a customer contacting you multiple times using various channels (email, phone, in person, etc.). This method can also account for outbound contacts from your organization to the customer. With CRM data, you can report on both Gross FCR and Net FCR.
As a reminder, Gross FCR is calculated by the total number of FCR-qualifying CRM records divided by the total number of all CRM records during a set duration. A qualifying record is a CRM contact with a reason code that doesn’t appear again on the same account in a given time period, and does not result in an action item. It assumes that if the contact had no action item and there is not a duplicate contact with the same reason code, FCR was achieved.
For example:
- FCR is achieved when a customer calls to ask how to set up a product and the service associate successfully assists the customer in setting up the product during that interaction. This means the service associate does not need to create an action item for additional action by anyone at the organization.
- FCR is not achieved when a customer requests a bill adjustment and the service associate generates an action item for follow up by the billing team.
- FCR is not achieved when a customer reports a broken product and a service order is generated for field services to repair the product.
- FCR is not achieved when a customer calls to ask for duplicate bill to be sent, and then sends a message days later to request the same thing.
Net FCR is calculated the same way, but filters out any CRM interaction records that a service associate would not be expected to handle on the first contact. For example, if your organization does not allow a service associate to handle a billing adjustment greater than $1,000, and that action must be completed by the billing department, it should always result in a handoff and follow-up – meaning it will never qualify as FCR. As such, any CRM records with a Reason Code that requires follow-up by organizational process should be removed from the Net FCR calculation. This helps us understand how many times service associates are achieving FCR, but only when they’re actually able to do so. You should approach this measurement strategically and ensure that 1) you understand which processes require handoffs, 2) you can systematically track these in your CRM system.
Specifics on the method:
- Both Gross FCR and Net FCR will eliminate any CRM records that indicate multiple contacts occurred for the same reason, meaning that they do not qualify as FCR. These multiple contacts are identified when: A single customer has multiple CRM records with the same Reason Code within a specific timeframe, and/or A CRM record has a linked action item.
- Gross FCR is calculated by taking the total number of qualifying CRM records divided by the total number of CRM records.
- Net FCR is calculated by taking the subset of reason codes that are expected to achieve FCR and dividing the total number of qualifying CRM records by the total subset of Net FCR CRM records.
- This is often the only FCR method that accounts for all channels.
Considerations for this method:
- The accuracy of this report heavily relies on service associates entering the correct CRM reason codes for customer contacts. This report can produce false positives or false negatives if an incorrect reason code is entered. For example, if a customer calls once and a reason code is chosen for that call, then the customer calls back regarding the same call reason and the incorrect reason code is chosen, the calls will both be counted as FCR when they should not have been. On the other hand, a false negative will occur if a customer calls for two different reasons, and the same reason code is selected, discounting them from FCR qualification.
- The accuracy of this report heavily relies on employees linking action item records when appropriate. If an action item record is not generated, the CRM may be included as FCR when the contact reason was not actually resolved during that interaction.
- In a Net FCR calculation, false positives can occur when a service associate chooses the wrong reason code. In this scenario, a reason code that is considered not resolvable on the first interaction, is selected incorrectly, when in fact, the reason code that should have been selected is considered resolvable.
- Net FCR will inappropriately exclude any contacts that are tied to a reason code that is not expected to achieve FCR, but in fact does in a certain situation. An example of this is when a customer calls to request a bill adjustment, but the service associate informs the customer that they are not eligible for an adjustment. Because no follow-up is needed, this call does in fact achieve FCR. However, if Net FCR systematically excludes all contacts with a reason code of adjustment, because it normally requires a follow-up, this CRM record would not be included in the Net FCR calculation.
- Consider how your CRM system tracks and reports on single interaction with multiple reason codes. Depending on how the data is reported, it could potentially inflate your data.
Purpose/How to use this method:
This report is most useful in understanding the relationship between contact reasons and action items. It should be used to drive process changes to increase Gross FCR %.
GROSS FCR %
Use this report as an indicator of the customer’s perception of FCR, or how easy it is to do business with you. Action Items:
- Look at this number at least every two weeks to understand trends.
- Notice the difference between the Gross FCR and the Net FCR.
- When Gross FCR is below target (and Net FCR is at or above target), drill down into contact reasons to see which reasons create the most contacts and investigate business changes to streamline identified processes.
- Use this information to target process changes for reason codes that drive the highest volume of repeat contacts, to in turn drive reductions in operational costs.
- Identify contact reasons that can be handled through self-service. Consider business changes to the portal or website to deflect these interactions to a self-service channel and reduce operational costs.
- For CRM records that you would expect to have achieved FCR, identify consistent issues with documentation or processes. Use this information to target training of staff or process change needs.
NET FCR %
Use this report to look at staff performance. If your Net FCR is low, then you know you have incoming repeat contacts due to service associate error. Remember that this FCR % only includes data from CRM reason codes that should be resolved on the first contact and has no expected/linked action item or follow-up. Action Items:
- Look at this number at least every two weeks to understand trends.
- When FCR is below target, drill down to into contact reasons to see which reasons create the most contacts and determine if additional training is needed to drive FCR.
- Be mindful of reason codes that do not qualify for Net FCR. Ensure that the team is following the right process to generate expected action items. If they are following the right processes but the FCR rate is still high for that reason code, consider adding it to the Net FCR list to include it in the calculation.
- Be mindful of reason codes that qualify for Net FCR. When they have a low FCR rate, ensure that the team is following the right processes. If they are following the right processes but the FCR rate is still low for that reason code, consider re-evaluating the process to ensure that the customer is having their needs met.
Quality monitoring program data
Measuring FCR through your Quality Monitoring (QM) Program is generally the most common method of FCR measurement and often argued to be the most accurate representation of overall FCR (see below). While this is not necessarily the case, it does have a couple of benefits that the other methods ignore, specifically, being able to target agent-level training on how to improve FCR rates. We will outline both the benefits and the constraints of QM FCR. But first, let’s review how QM FCR is structured.
A well-structured FCR measurement through a Quality Monitoring Program will look at a statistically valid sample of calls and answer the question, “Did this call achieve FCR?” The auditor is trained to evaluate FCR on criteria like:
- Did the customer or service associate mention that the customer had already contacted us in any way for the same reason?
- Was the call transferred?
- Did the service associate ask the customer to call back or send in a form?
- Did the service associate tell the customer that we will have to follow up or call them back with an answer?
- Did the customer indicate that they would continue to research on their own?
If the answer is yes to any of these questions, the call would not qualify for FCR. The auditor will mark one of three answers to the FCR question:
Yes
- This is selected when the call achieves FCR – even if the right processes and procedures were not followed. If the customer’s call is resolved during the single interaction – the call achieved FCR.
- Whether or not the right processes and procedures were followed should be documented in the audit form itself.
No – due to processes
- This is selected when the service associate followed the right processes and procedures, but FCR was still not achieved. This would occur for situations like the customer calling for a rate adjustment that a different person/team must complete at a later date/time. It would also occur when the organizational process requires the customer to complete a follow-up action.
- If the service associate followed the right processes and procedures, this should be documented in the audit form.
No – due to agent error
- This is selected when the service associate did not follow the right processes and procedures, so FCR was not achieved when it should have been. This would occur for situations that the agent is expected to be able to resolve but didn’t. For example, the customer calls to purchase an additional product, and instead of completing the sale, the service associate inappropriately passes the work off to a different employee.
- If the service associate did not follow the right processes and procedures, this should be documented in the audit form.
With this data, we can calculate both Gross and Net FCR. Gross FCR is the percentage of calls that the QM auditor marks “yes” divided by all audited calls. Net FCR is the percentage of calls that the auditor marks “yes” divided by audited calls that received a “yes” or “no- due to agent error.” For Net FCR, “no – due to processes” is excluded because service associates are not expected to achieve FCR on that call.
You can choose to incorporate the audit question for FCR in the agent’s audit score overall or track it separately. It may be beneficial to leave FCR out of the scores for a period of time as agents get use to focusing on FCR. Once your agents have had enough time acclimating to the metric, consider incorporating Net FCR rates into service associate audit scores to help drive accountability and performance. Do not include Gross FCR as service associates do not have control over FCR if it is driven by processes and procedures.
Some organizations choose to have agents self-evaluate FCR and document it within their agent-desktop tool or CRM. We’ve found that this method tends to be the least objective and misreporting is common. If you choose to use this method, we highly recommend supplementing this with a QM audit question that validates the agent’s self-rating. This way, you can have the agent’s rank 100% of interactions and use the QM method to validate their findings.
Specifics on the method:
- This report pulls data from the responses to a single question in the audit form. As part of the standard QM program, the auditor will listen to a random sample of phone calls and document if the call qualifies as FCR (one question, three potential responses). If a statistically valid number of audits exist, then the QM FCR will also be statistically significant. If a statistically valid number of audits is not completed each month, FCR scores won’t be statistically significant.
- While in other methods, you must set the duration over which you are pulling your FCR data, it is important to understand that duration is not relevant for QM in the same way it is for other methods. QM FCR is a single data point from a snapshot of an interaction, using assumption around whether or not the customer had contacted you in the past or will contact you again. It is not analysis over time like other methods are; it does not empirically check for multiple contacts.
Considerations for the method:
- Unless your QM Program evaluates a statically significant population of every interaction channel, it is important to note that QM often evaluates call data only. This has the potential to eliminate repeat contacts made in person, via SMS, chat, portal, fax, email, or any other communication channel. It is important for the auditor when listening to the recording to be mindful of any mention of another related contact or interaction.
- This method also relies heavily on auditor perception of FCR. Auditors must be knowledgeable about company policies and procedures and be mindful of the questions/comments listed above to help determine if a call achieved FCR. This, and auditor calibration sessions should help reduce the subjectivity element.
- This method could contain false positives for situations where the customer, service associate, or auditor believes that FCR is achieved, but additional follow up did, in fact occur. Because the method does not empirically check for contacts over time (we don’t really know if the customer ever contacted us again), it is reliant on the assumption of previous or future contacts.
- Unlike telephony or CRM data, this method can take context into account and avoids any issues with unclean or unstructured data. This can be extremely beneficial given the complexity and ambiguity of FCR.
Purpose/How to use the method:
GROSS FCR %
Use this report as an indicator of the customer’s perception of FCR, or how easy it is to do business with your organization as a whole. Action Items:
- Look at this number at least every two weeks to understand trends.
- Notice the difference between the Gross FCR and the Net FCR. When Gross FCR is below target (and Net FCR is at or above target), investigate audits with a reason of “no – due to processes” to identify opportunities for changes in business processes to increase FCR.
NET FCR %
Use this report to look at staff performance. If your Net FCR is low, identify training opportunities. Reminder: This FCR % only includes data from calls that should be resolved on the first contact – does not count “no – due to processes." Action Items:
- Look at this number at least every two weeks to understand trends.
- When FCR is below target, drill down to into service associate-level FCR to see which service associates struggle with FCR the most.
Evaluate QM FCR by service associate
Review agent-level FCR rates across all audits. Use this to understand which service associates are struggling with FCR the most and identify targeted training opportunities to drive FCR for each service associate. Keep in mind that service associates should only be held accountable for Net FCR. Action Items:
- View Net FCR rates for each service associate. For service associates with low FCR rates, investigate training opportunities to increase FCR. Be sure to include this in coaching sessions and audit reviews.
Post-interaction survey data
To capture the customer’s perspective, organizations can also use survey responses to measure FCR. Surveys can be executed across multiple channels but for the purpose of FCR, they must be transactional. This means that the surveys must follow and be specific to a certain transaction (post-interaction), regardless of the channel. Surveys can also be distributed in a variety of ways. Many software tools exist that can help you design surveys specific to each channel, distribute them in a variety of ways, and integrate your results for a comprehensive view.
Distribution methods for a post-interaction survey may include:
- Phone (agent-driven)
- Phone (IVR-driven)
- Text Message
- Web
To capture FCR, your survey must include a question that asks whether or not the customers question was resolved. One example of an FCR-specific question may be: “I was provided accurate and complete answers to my question(s) and/or issue(s).” Answers available as a response to this question could be a numerical range (ex: 1-5) or Yes/No/Not Applicable, or some variation therein. For the purposes of this guide, we will assume that the available answers are Yes/No/Not Applicable.
In this case, the Gross FCR percentage can be calculated by taking the total number of “Yes” responses divided by the total number of “Yes” and “No” responses. The “Not Applicable” responses should be excluded from the calculation.
Keep in mind that surveys can generally be distributed either immediately or after a specified delay. There are strategic benefits to either approach and benefits vary across different channels and distribution methods. When planning any survey, be sure to understand the average response rates of each channel across each method of distribution. In addition, you can choose to send a survey after every interaction or after a subset of interactions. Again, there are pros and cons to each method so be strategic about how you would like these surveys to be sent.
Considerations for this method:
- Survey responses capture FCR entirely from the customer’s perspective, which may not be an accurate reflection of whether or not the issue was actually resolved. Often, customers respond to these types of questions based on whether or not they agreed with the resolution.
- For example, if a customer calls about replacing a product and learns that she needs to ship the broken product back before receiving a replacement, she might answer the question “Was your contact reason resolved?” as yes, which would count as FCR in the survey but we would not consider this FCR; a false positive.
- On the other hand, if a customer calls and ask to have their late fees removed and he is told that he doesn’t qualify for it, he might answer the question “Was your contact reason resolved?” as no, which would not count the call as FCR in the survey while we would, in fact, consider this to be FCR; a false negative.
- Though organizations should highly value customer feedback, survey data also tends to be the least statistically significant sample size for FCR since it does not account for the full data set or even a representative sample (depending on response rates).
- Surveys tend to receive responses from outliers, or extremes on both ends of the spectrum. In other words, you are most likely to get responses from either very happy or very angry customers, which can skew the results.
Purpose/How to use this method:
- Survey results are the most accurate reflection of the customer’s perception of FCR.
- Use this data to understand how your customers perceive how easy it is to do business with you by understanding if they think your various channels of support are effective at resolving their issues in a timely manner.
- Review customer comments in your surveys to better understand what the customer is looking for and how to meet their needs.
- For low FCR rates in self-service channels, consider making changes to the tool’s design to either increase functionality for self-service or make information more easily assessable (ex: FAQs on the website, expanding self-service on the portal, making mobile easier to navigate, etc.).
- For low FCR rates in interaction channels (chat, phone), investigate process changes that will increase customer satisfaction, even if it requires an upfront financial hit to your organization. Often, restructuring a process to drive a higher FCR will increase costs up front (ex: longer process duration) but have an overall positive ROI by reducing call backs.
Chapter 4: Key drivers of FCR
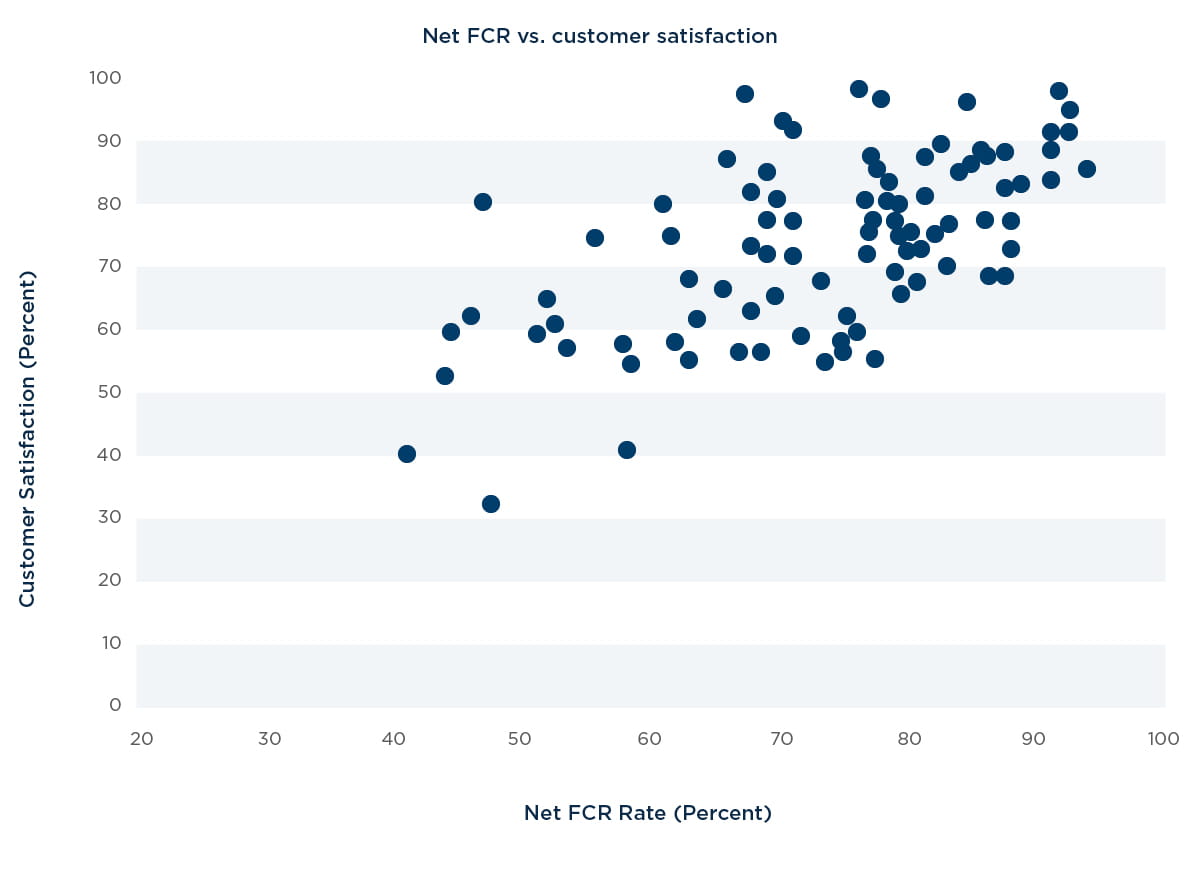
Now that we know that FCR is one of the most important drivers of customer satisfaction in a contact center, and how to measure it, it is important to understand some of the primary causes of a low FCR rate and some of the best ways to drive a high FCR rate.
The root cause of a low FCR rate may be different for each organization and may even be different for each contact reason. Below is a list of common causes, many of which have been mentioned throughout this guide:
- Corporate policies/processes require a handoff or follow-up by an employee after the first interaction.
- Corporate policies/processes require follow-up by the customer after the first interaction.
- Service associate did not have the information to answer the question.
- Service associate lacks the authority (empowerment) to solve the problem.
- Prior contacts provided unclear or incorrect information.
- Customer disagreed with the outcome.
- Customer was frustrated or had difficulties with self-service.
With these common challenges in mind, what should organizations do to drive a high FCR rate? It differs for Gross FCR and Net FCR:
- The most statistically significant impact on Gross FCR is policies and procedures. If you want your agents to be able to resolve a customer’s contact during the first interaction, your policies and procedures need to be structured in a way that minimizes handoffs and follow-on tasks. How can you restructure your workflows to focus on true FCR? Once the right policies and procedures are in place, it is helpful to provide the right tools and technologies to support your agents in following these structures.
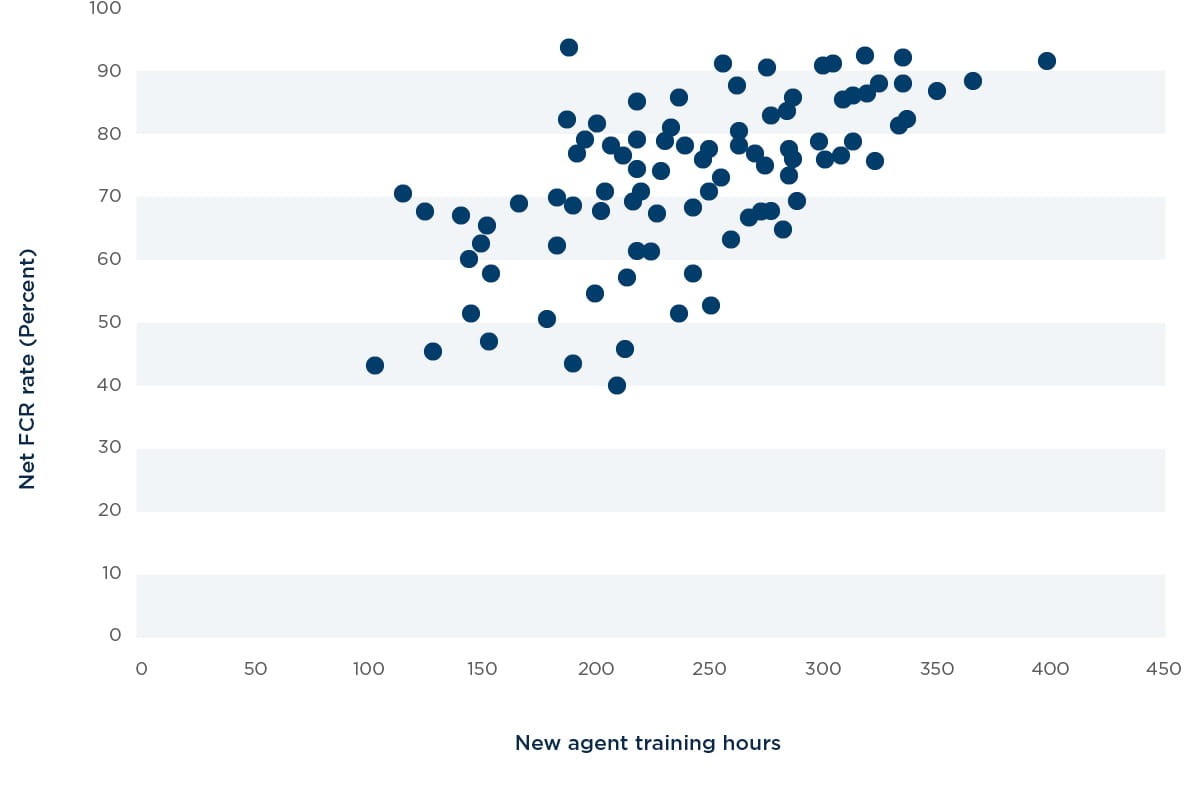
- The most statistically significant impact on Net FCR is agent training. If an agent is expected to achieve FCR for certain contact reasons, then the only way to ensure it is to make sure they are educated and informed about how to handle the contact reason and achieve FCR. The relationship between FCR and training hours is highly positive (see graph below for an illustration). This is true for both new hire training as well as ongoing training for tenured agents. By focusing time and effort on training, you can continue to drive FCR toward increasing targets.
Related to agent training, FCR can be improved by informing service associates of external events and developments (like product changes, price changes, and new marketing/communications) before the customers find out, and preparing the service associates with what they need to handle the contact. Every service associate should possess contact information for subject matter experts who are committed to supporting the contact center. Service associates, particularly the more senior ones, should have the authority to make carefully constrained decisions and provide concessions without seeking approval. Finally, training that addresses FCR specifically can provide best-practice solutions at both the management and service associate levels.
Remember, your FCR rates reflect organizational processes, the effectiveness of service associate training, the capabilities of your self-service channels, and the quality of the tools and information provided to service associates to resolve contact reasons.
Chapter 5: Operating First Contact Resolution
Congratulations! You are now an expert on FCR. So how do you translate all this new information into practice? Let’s summarize the key takeaways into six tactical steps that will prepare your organization to use FCR metrics.
1. Determine your goal
Invite key stakeholders to explain WHY they want to measure FCR. Getting this right is vital. The purpose of the metric at your organization should determine how you define and measure it.
2. Define what FCR means to your organization
Once you know what the metric should tell you, determine how FCR should be defined. Think of cases that meet FCR and cases that do not meet FCR and ensure that your stakeholders agree with what does and does not count as FCR. Remember to consider the customer’s perspective as well as the organization’s perspective, as appropriate.
3. Determine how to measure and report on FCR
Identify the data sources available to you that can help you measure FCR. The reporting methods in this guide are a good starting place. Once you know where you will be getting the data from, understand how the data can be exported or extrapolated to get the measure you need. Determine what timeframe you will be reporting against (if needed) and how often you will be reporting on the metric. Will you be using a rolling timeframe or a set timeframe? Include your technical or data architects to help you develop the exact calculation that you will be using and where the data will be coming from.
4. Communicate what FCR is, what it means, and what it will inform
As you now well know, FCR is a confusing metric and means different things to different people. A key step in the process of using FCR is to communicate to your stakeholders that you are now measuring FCR. In this communication, make sure it is clear why you are measuring it, how you are defining it, and what you will do with the data. Your stakeholders should include front line, your business partners (ex: marketing, billing, sales), your leadership, and even your customers.
5. Use FCR to inform change
Like any metric, FCR is only useful if you actually act upon the insights that the data can give you. As outlined in this guide, use this information to drive process improvements, targeted training, and self-service optimization.
6. Share your results
Change has the most positive impact when it is understood. Share your success with your organization and customers. If you changed a process to increase FCR, let people know! If you made a significant improvement in FCR, let people know! If you reduced call-backs and therefore costs as a result of increasing your FCR, let people know!
Measuring First Contact Resolution and acting on it can have a powerful impact on your organization and can substantially reduce costs and increase your customer satisfaction. Get started today! If you need a partner to help design and enact improvements at your contact center, reach out to our Customer Experience experts at West Monroe Partners.