July 2019 | Point of View
Evaluating modern data warehouse platforms with a performance per-dollar approach
Introduction
A modern data warehouse platform acts as the centralized data reporting foundation for any data- driven organization. If you’re not building a data warehouse, chances are you may be considering it or are simply maintaining your data warehouse in order to centralize and tap into actionable data within your organization.
This whitepaper helps guide decision makers on the important factors at play when assessing data warehouse platforms and gives tangible performance metrics to help support their decisions. The performance-per-dollar approach provides an effective way to evaluate platforms by focusing on two metrics that matter for every customer: performance and cost of ownership. These metrics tend to be most important for organizations because they quantify operational costs of the platform for the required performance and scale. To make the comparison easier, we combined these into a single performance-per-dollar metric described below.
As a group of data and analytics practitioners, we wanted to see how data warehouse vendor claims held up and which aspects turned out to be not so scientific. This is not a scientific approach, but simply an exercise that our data and analytics team approached to best make well-informed recommendations for organizations when choosing the best data warehouse platform for their organization.
Evaluation: Evaluating 5 leading data warehouse platforms
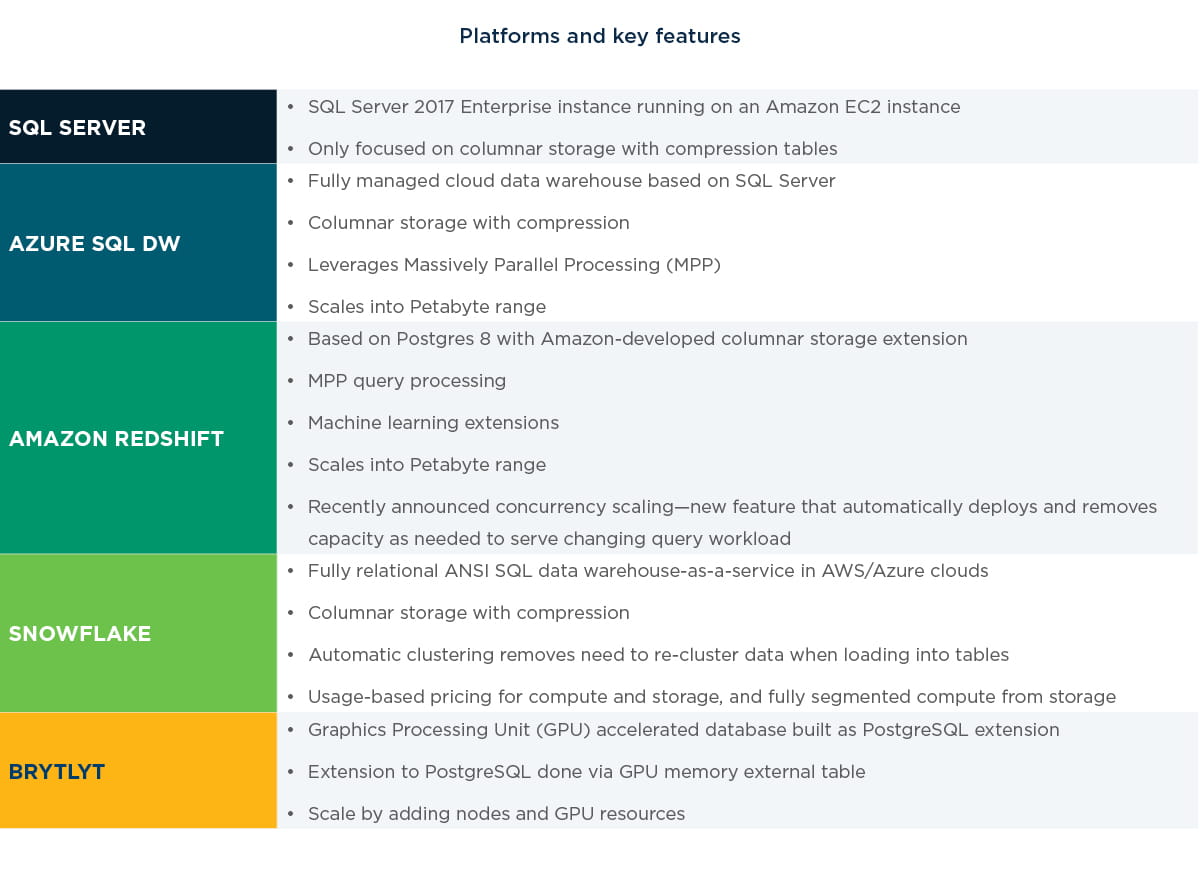
For this comparison, we started by selecting four leading data warehouse platforms used by our data engineering practice at West Monroe to implement data solutions. This was a fairly narrowly focused analysis based on cost of performance, though we are not claiming to have tested features comprehensively. These data engineering solutions include dashboarding, data warehousing, data source integration, and advanced analytics, including Machine Learning and AI. These solutions require a foundational platform that offers a wide array of features alongside powerful performance.
To round out the list to five platforms, we selected the new, GPU-based Brytlyt platform. GPU computing is a fast-evolving field, and we wanted to gain experience with it to see how it compares with more traditional columnar databases.
For consistency, we chose to standardize on AWS cloud infrastructure where possible, minimizing any differences in infrastructure architectures.
Measuring Data Warehouse Performance Metrics
Having all five contenders hosted in the cloud enables easy conversion of performance to hourly run cost which we will use to normalize observed performance results.
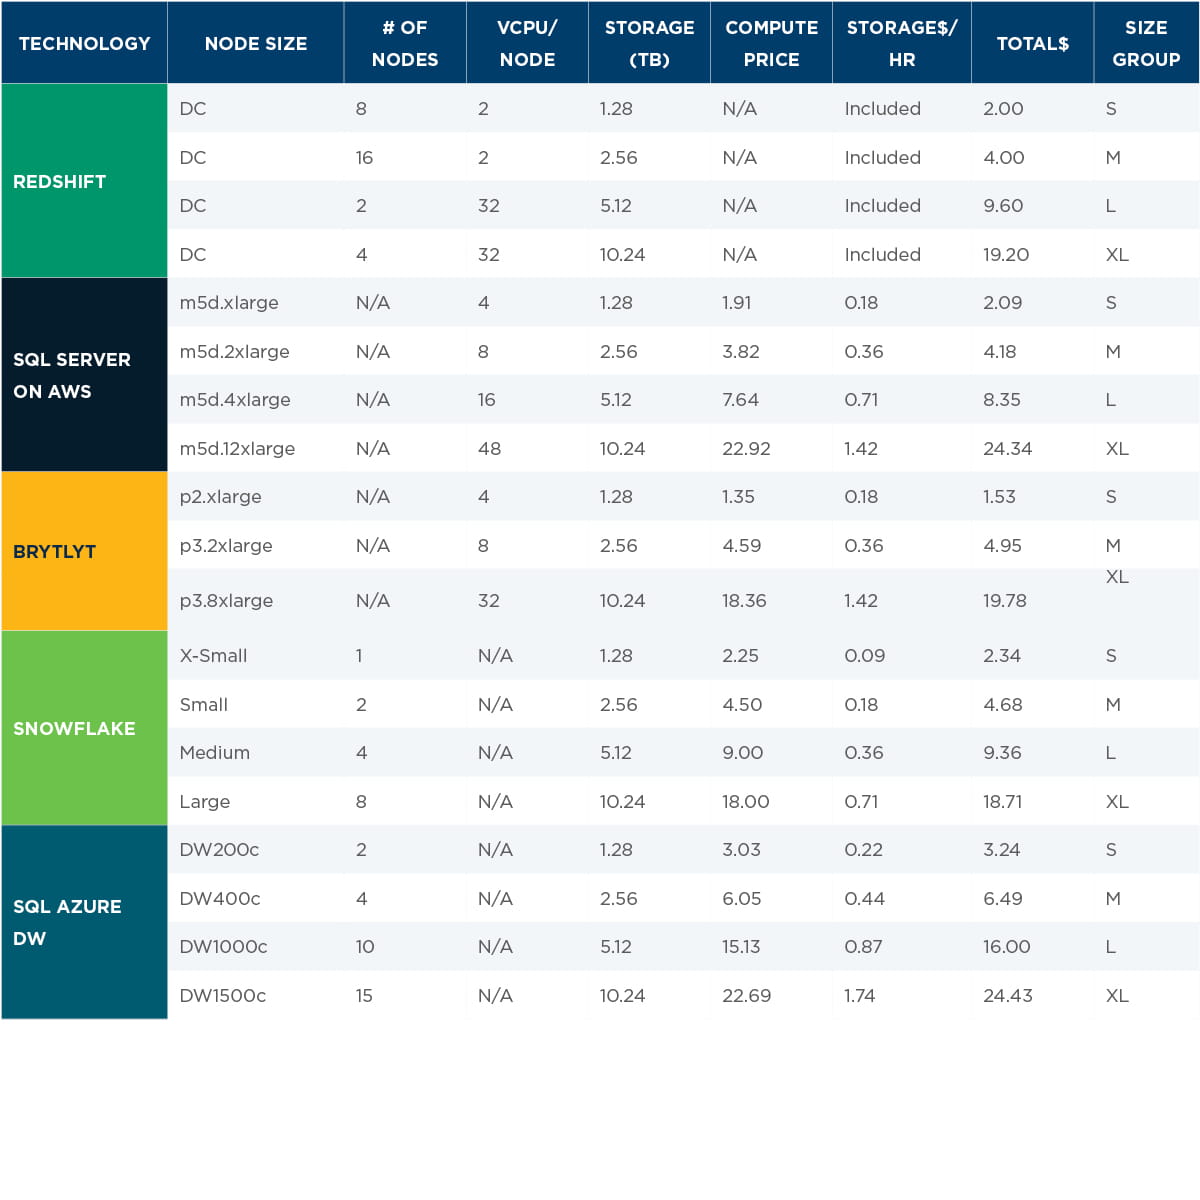
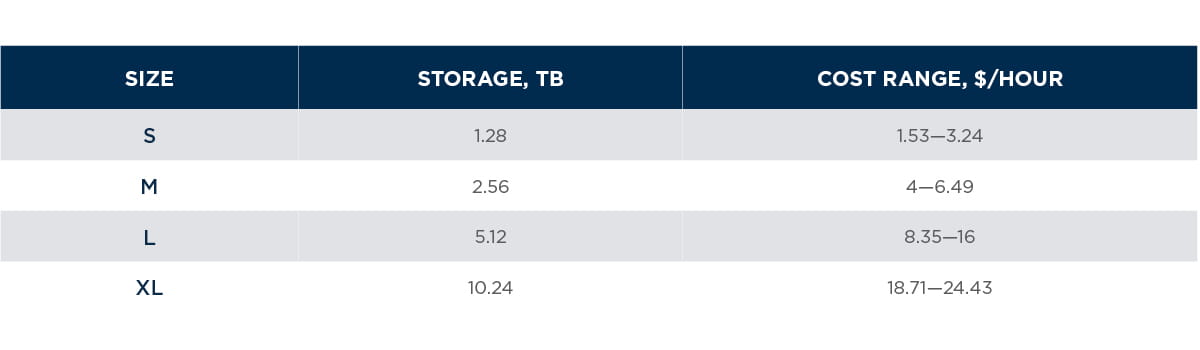
For each technology, we came up with four deployment sizes from small to extra-large in order to align contenders as close as possible on cost per hour, compute, and storage capacity. The table below summarizes sizing:
Testing Setup
For the test data, we chose the New York taxi dataset, primarily due to the large amount of data available. The yellow taxi sub-set of data contains records with fields containing timestamps, locations, and fares related to the New York taxi yellow cab trips. One month of the taxi data was about 8 million to 10 million records of data. For our testing, we decided to create and test across small, medium, and large taxi tables of 9 million records, 108 million records, and 1.1 billion records, respectively. The tables also correspond to one month, one year, and seven and a half years of taxi data respectively. Each size up represents roughly a 10x jump in dataset size.
A West Monroe-developed accelerator, the Rapid Analytics Platform (RAP), was used to land, stage, conform, partition and save the taxi data as flat files to Amazon S3. Bulk copy methods available to each data warehouse were then used to then load the datasets into the respective platforms.
Three queries were generated by Power BI in direct query mode for the tests. The three queries used were similar to what would be found in a basic report.
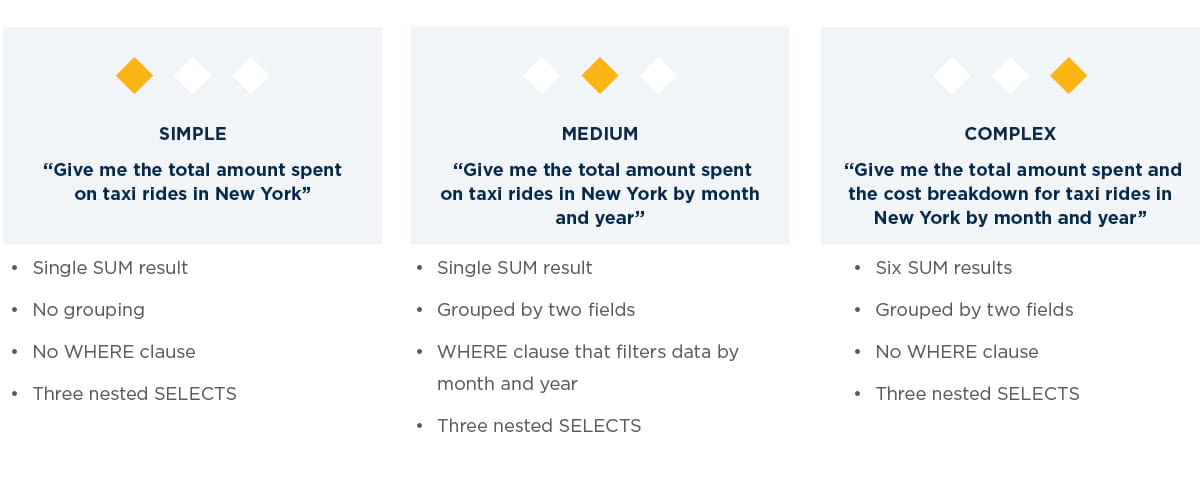
Queries were generated by Power BI in SQL Server direct query mode, and then manually tweaked for SQL compatibility with other platforms. Full versions of the initially generated queries can be found in on GitHub.
Assumptions in the Analysis of Data Warehouse Platforms
For the purpose of simplifying this evaluation, we made the following assumptions:
- Multi-user concurrency was not tested—we will include it in our future evaluations
- All SQL queries were directed to a single table with no JOINs
- For all platforms except Brytlyt, datasets were stored in columnar table with default configuration, no platform-specific table/index performance tuning was performed
- All table structures created for each platform were created to match as close as possible. Adjustments were made to accommodate SQL flavor differences (e.g. timestamp vs. datetime)
- In Brytlyt, unsupported decimal types were replaced with floating point types
- We were unable to test Brytlyt performance on the Large dataset. Brytlyt results were extrapolated using small and medium tests.
Testing Harness
In order to speed up the testing process and mitigate the influence of human error, hardware variance, and other external factors, a simple testing harness was created
to automatically execute all queries and record their execution times. After running each query, results were inserted directly to a SQL Server table created for results tracking. This table recorded the DB type, DB size, query type, table size, and total execution time of each query. Tests were performed for all combinations, except for Brytlyt, which was unable to fit the medium sized table in memory on S/M instance sizes and unable to fit the large dataset on any of our tested configurations. The testing harness code can be found here.
Results
With the results of each query execution stored in a SQL Server table, we then created a Power BI dashboard. All resulting data used to generate these dashboards can be found on GitHub. Summary results and results based on source data set size can be found on the following pages.
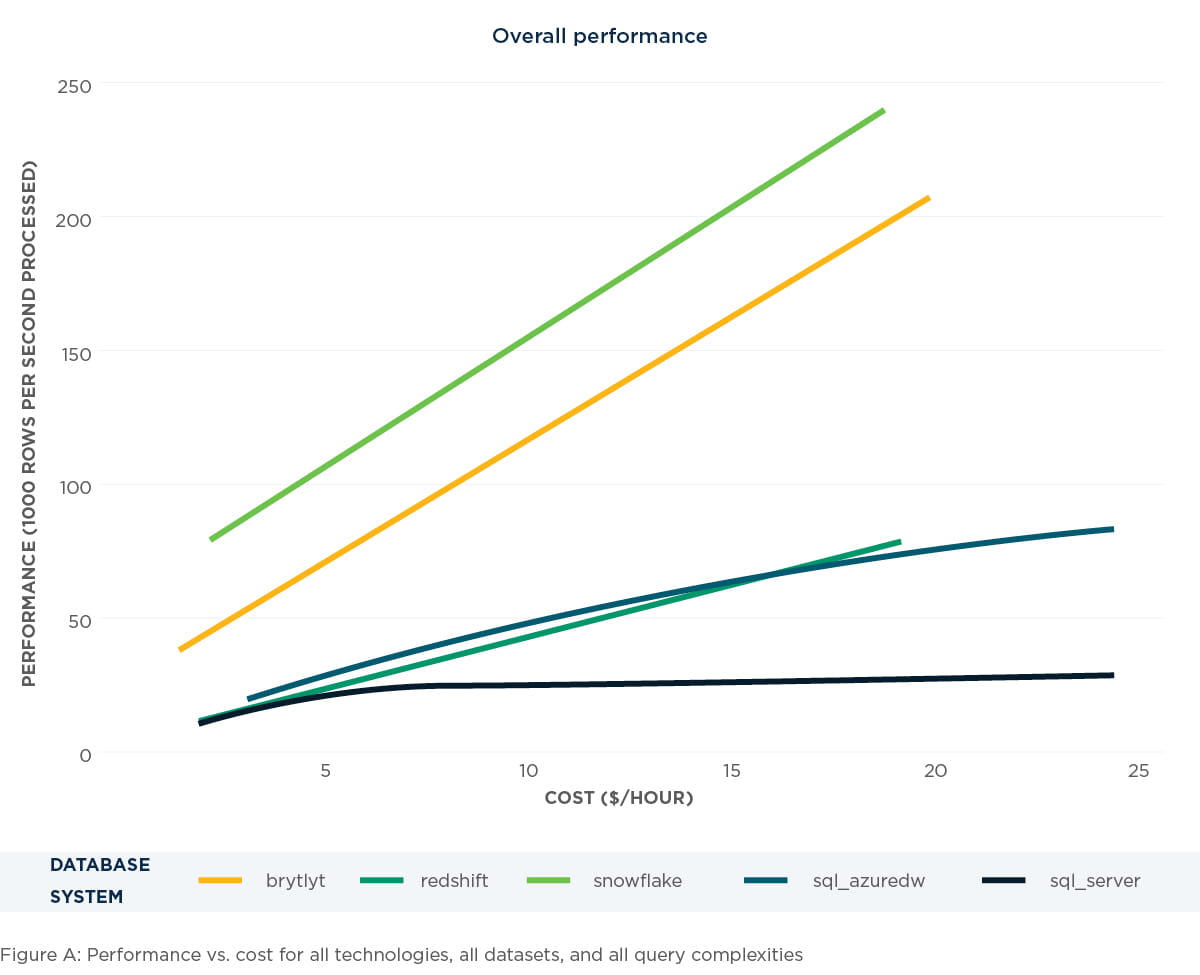
Overall performance
Across all dataset sizes and query complexities we found that the newer technologies, Snowflake and Brytlyt, increased their performance per dollar rate linearly as spending increased. More mature cloud MPP technologies, Azure DW and Redshift, were able to scale near-linear with increased spending but had an overall lower performance per dollar rating than their cloud scale peers. Finally, the cloud hosted SQL Server demonstrated logarithmic ceiling with increased spending, flat lining at around 25 million rows per second. Figure A below contains visual representation of these observations. The horizontal axis represents cost in dollars per hour, and the vertical axis represents performance in 1,000 rows per second processed.
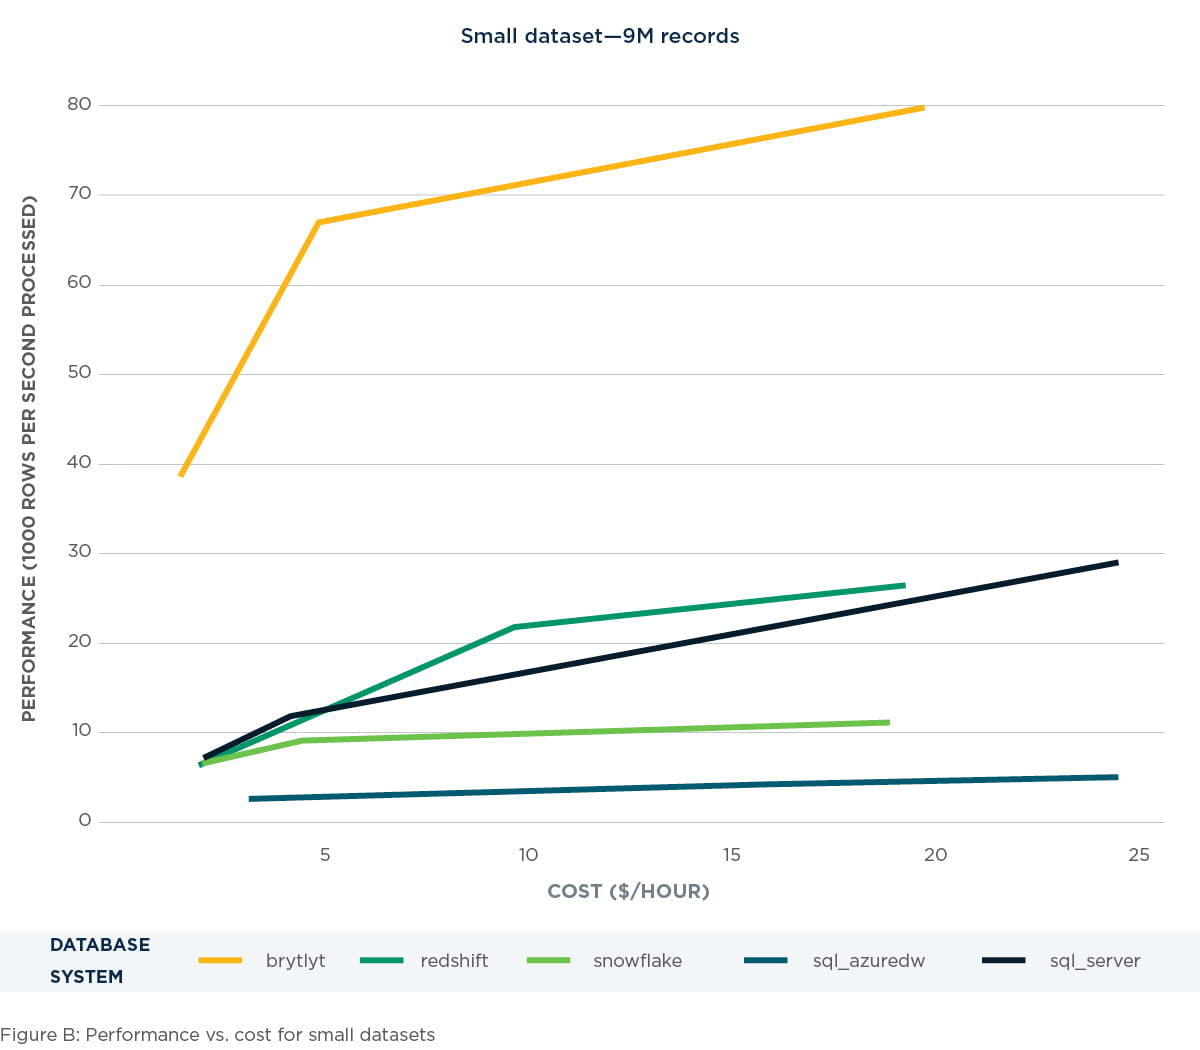
Small dataset – 9 million records
When performing queries on small datasets, we found Brytlyt to be dominant in comparison to the other technologies tested. The performance metrics of Brytlyt were consistently two to three times higher than that of the other technologies. See details in figure B below.
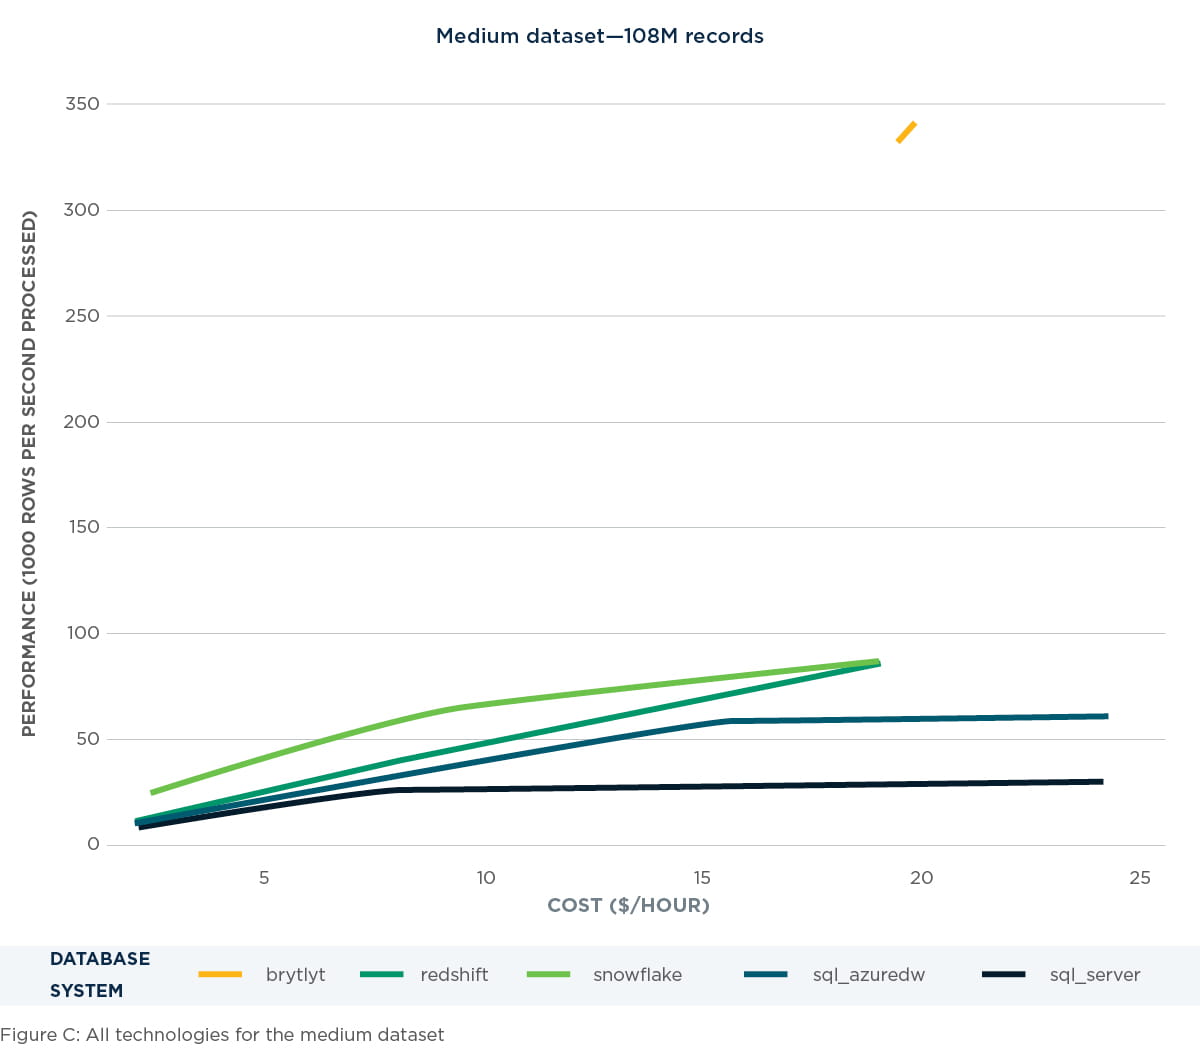
Medium dataset – 108 million records
Performing queries on the medium-sized dataset pushed the GPU based Brytlyt to its limits. At the largest server size, Brytlyt continued to perform with substantially higher performance than the other measured technologies. However, Brytlyt was unable to operate on this dataset at lower costs due to memory constraints. This can be seen in Figure C below.
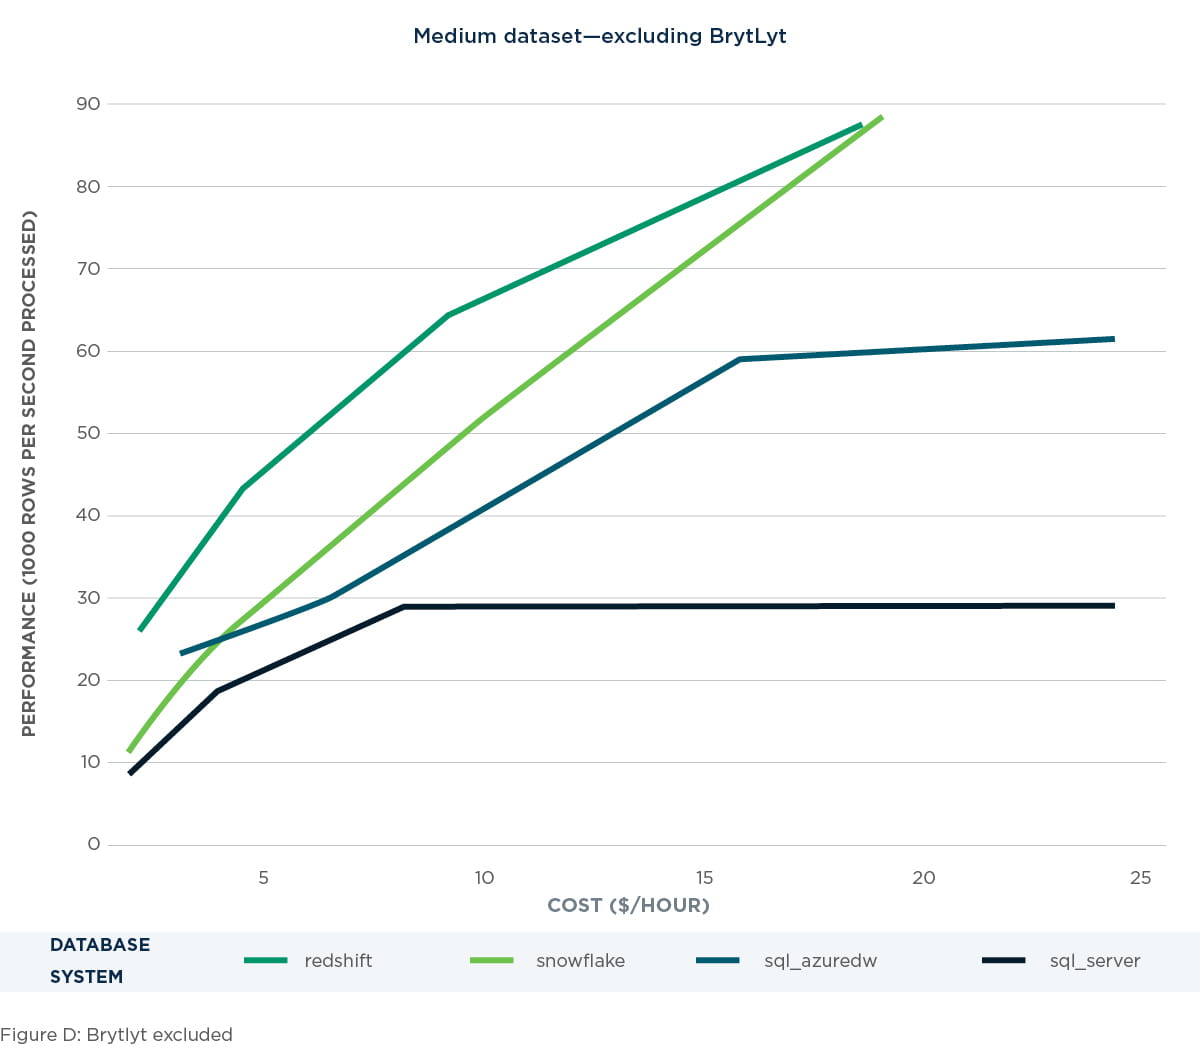
Medium dataset – excluding Brytlyt
Excluding Brytlyt, as seen in Figure D below, allows us to better see the performance of the other technologies. SQL Server shows its diminishing return on spend here while the other technologies continue to show near-linear growth.
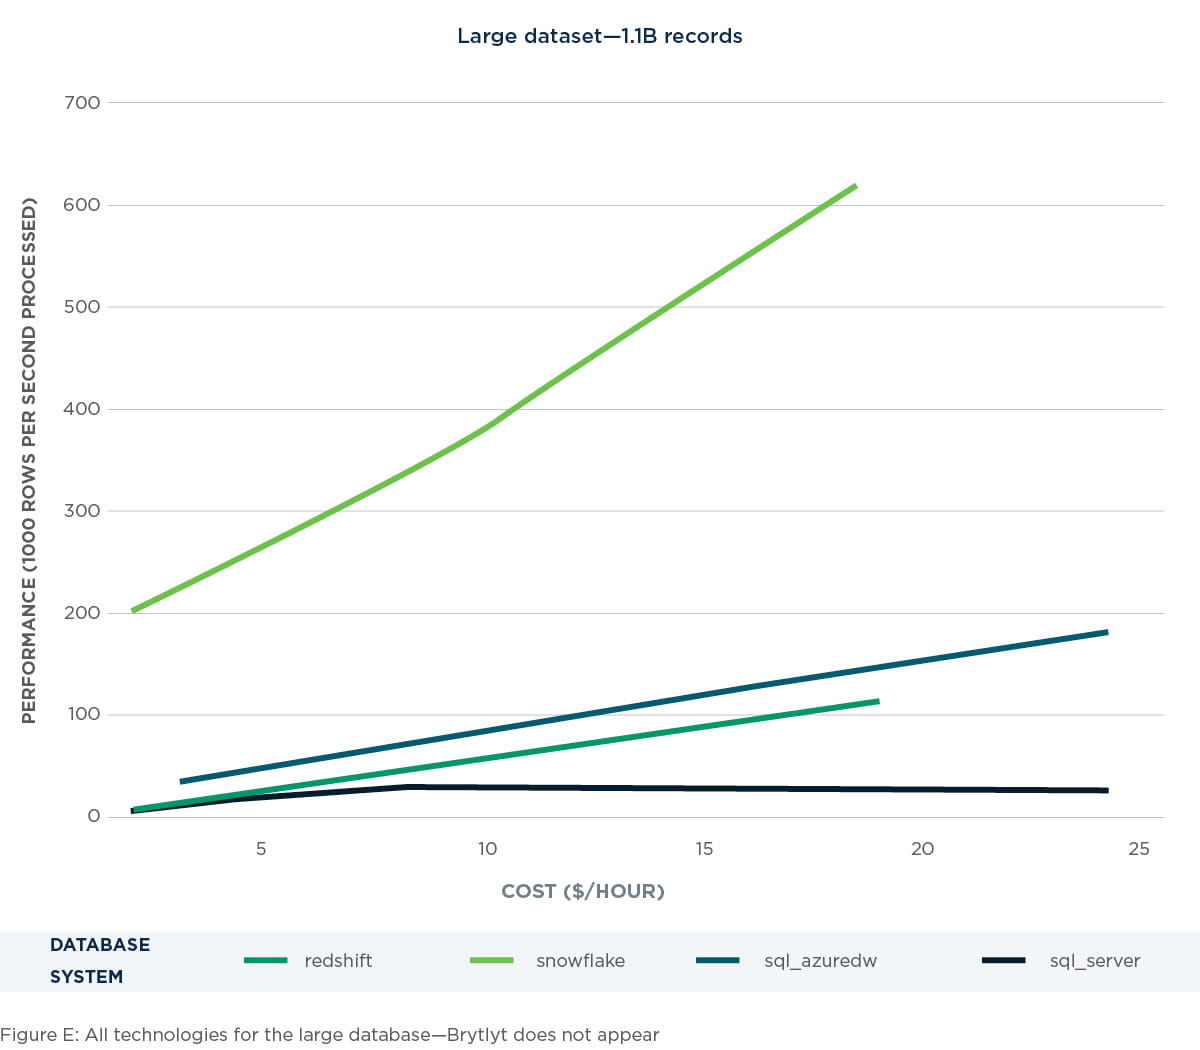
Large dataset – 1.1 billion records
For the large data sets, we have no Brytlyt metrics because the dataset was too large to fit into a memory table and perform queries with any of our tested server sizes. Of the other technologies, Snowflake is clearly dominant here, achieving five to six times the performance of other technologies and continuing to scale in a linear fashion based on spend. Redshift and Azure DW begin with lower performance at low spend and scaled less per dollar as the spend increased. SQL Server shows the lowest starting performance overall and completely flat lines beyond $8/hour (16 cores) as spending increases. This can be seen in Figure E.
Conclusion
1. Snowflake came out on top in almost all areas.
Using our performance-per-dollar measure, Snowflake drives four times more cost efficiency compared to Redshift and SQL Azure DW.
Additional observations:
- If your usage patterns are intermittent and spiky, as is typical for many data warehousing implementations, Snowflake can drive even greater efficiency with automatic start/stop and instant, seamless scaling
- Snowflake was fastest to load data from AWS S3
It was, in general, the easiest data warehouse platform to work with—no external tools required, loading/queries and monitoring can be done via a web-based UI.
2. Brytlyt outperformed all systems on complex query executions.
Although we were unable to test with the largest dataset due to memory constraints, our results show clear benefits vs. the competition on a performance-per-dollar basis if you primarily process extremely complex or compute intensive queries.
Additional observations:
- Based on our experience, the platform is not yet mature enough to act as an enterprise data warehouse
- It’s more of a high-performant caching/calculation engine then a traditional reporting database
- GPU-enabled tables lack persistence and need to be loaded into memory before each use
- GPU memory management lacks stability, resulting in frequent crashes
- GPU tables don’t support common SQL data types such as exact numeric/decimal, which limits its suitability for precise financial calculations
3. AWS Redshift vs. Azure SQL DW were very close in all tests, illustrating how close and competitive AWS and Azure are in their top-tier offerings.
- Both have two compute density options and easily scale into PB range
- Azure offers more flexibility by scaling storage independently from compute
4. SQL server worked well for small datasets but does not scale well.
This was expected, as it’s unable to leverage MPP scale of other platforms.
Future ideas for testing data warehouse platform performance
As previously stated, this was not an opinions-based result, but rather based on testing with parameters around cost of performance. By focusing on a single metric, we were able to uncover interesting results. In future work, we hope to expand on these results to include larger datasets, as well as a wider array of query types—most notably JOIN performance. For this first pass, we focused on a fully flattened, denormalized dataset, as it has become our target model for use with RAP.
Appendix: Platform cost and sizing
Appendix A
The table below illustrates sizes of each platform that we selected for our testing, aligned into size groups for an apple-to- apple comparison. Results were further adjusted by total hourly cost.